What INEOS, an Olympic champion, and a million analyzed power files reveal about the next performance unlock for pros and amateurs alike.
When INEOS Grenadiers and Netcompany announced their landmark AI partnership to power the future of performance, my reaction was the same one I’d guess most coaches and cyclists had: tell me more. What are they using AI for? What are they looking at? What have they found?
Sir Dave Brailsford has called AI the next performance unlock, and I agree completely. In fact, I think the prediction that AI will help win the Tour within five years is conservative.
The problem is he’s been very short on the details. For all the magazine headlines and podcast soundbites about AI “revolutionizing” cycling performance, the public hasn’t actually seen or had a chance to understand what’s possible when AI is applied to a rider and team’s data. INEOS and Netcompany have stayed at the headline level. UAE hasn’t said a word. Neither has Visma–Lease a Bike.
At FasCat, we’ve been working with AI and multi-year datasets for the past two years.
AI’s advantage is that it can analyze 5 or 10 years of data all at once and unlock insights that simply weren’t available when looking at one file at a time, which I’ve done close to a million times in my career.
More importantly, we’ve trained our AI how to analyze power data and what physiological relationships to look at. Ask it, “Over the past three years, tell me about this rider’s recovery and threshold power output,” and we get a detailed report on how the rider’s training volume drove their power output and affected their recovery. Or how taking more recovery days increased their power.
I believe every World Tour team will have an AI program within the next 24 months, maybe sooner. The teams that build them well will win races. The teams that don’t will get dropped. AI is the moneyball moment for cycling.
What follows is a walkthrough of what we’ve built, learned, and can do. If you’re at a World Tour team, a national federation, a development squad, or a coaching organization thinking through your AI roadmap, I’d genuinely welcome the conversation. Reach out directly: frank@fascatcoaching.com.
Power output wins bike races. AI unlocks more power output.
Let’s strip winning bike races down to physiology. Bike racing, at every level, from your local Tuesday-night crit to the Champs-Élysées, comes down to power output. Wattage, sustained over the right durations at the right moments, is the #1 determinant of performance. More power, more often, with better recovery, wins races.
Everything else like nutrition, aerodynamics, sleep, equipment, tactics, and one’s mental game, is in service of power output. And the good news: cyclists generate power output data every day, and most are sitting on 10+ years of it. That’s a treasure trove of insight waiting to be analyzed.
The more time we’ve spent training models on our 20 years of coaching experience alongside real athlete data, the more confident we are about how much more power is on the table for any given rider.
What we’ve learned: having all the historical data matters, but training the AI on the physiological relationships matters more.
The single biggest lesson from two years of this work: the model is only as good as the physiological framework you teach it to apply.
Anyone can plug ride files into a general-purpose large language model and ask questions. The output will sound confident and tell you very little. You’ll get “your training load is elevated, consider rest,” the kind of advice generic apps were giving us in 2014.
The performance gains live in the deep multi-year relationships. They live in the physiological cause-and-effect that turns numbers into insights that drive coaching decisions. Two pieces had to come together for our AI to do useful work:
- A proprietary dataset built over 20 years. I’ve personally analyzed close to a million power files across my coaching career. FasCat coaches collectively have analyzed many millions more, across every kind of athlete, from Cat 5 commuters to Grand Tour pros. That’s two decades of ground-truth observations: which training methodologies produce breakthroughs, and which produce stagnation. That dataset is the substrate the model learns on.
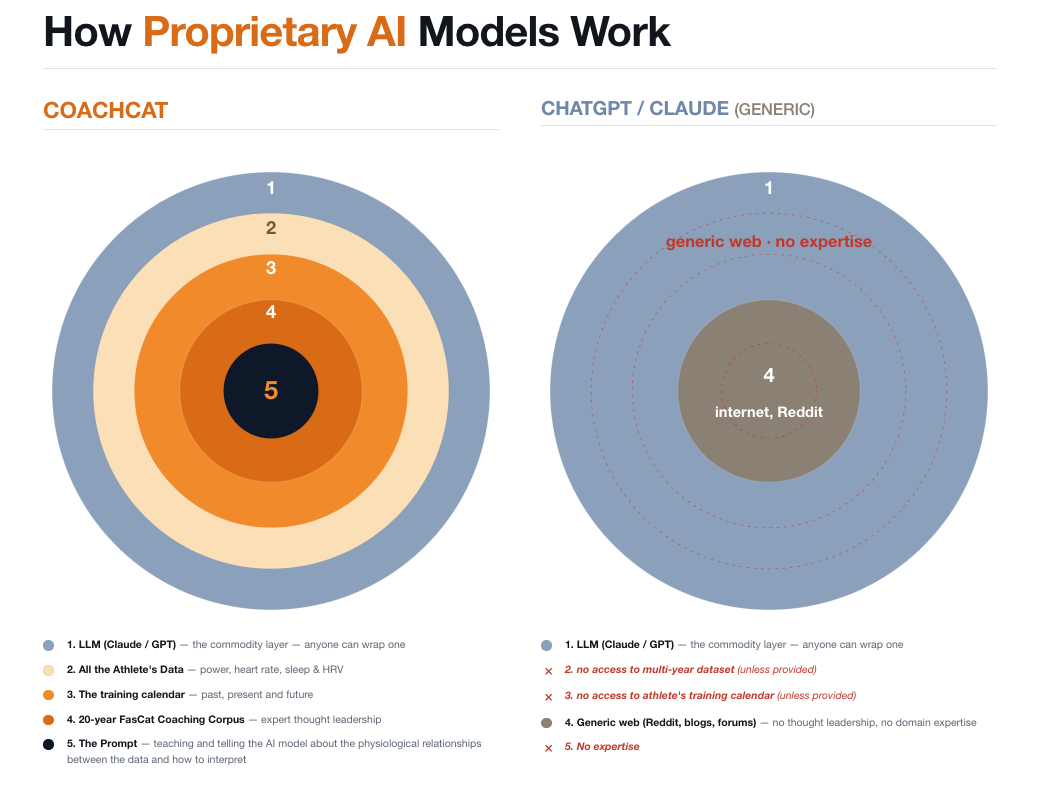
- Physiological connectors that the dataset teaches the model to find. This is the real unlock, and where most AI-in-cycling efforts will stall. We didn’t just feed the model files and ask it questions, or set it loose to find patterns on its own. We trained it on exercise physiology principles and coaching knowledge so it knows what to look at:
- Training load to power output, over weeks, months, and years
- Submaximal heart rate as an indicator of how hard the athlete’s effort actually was
- The relationship between sleep and recovery, and recovery’s direct impact on power output
- The rider’s Critical Power / FTP / submaximal heart-rate power prediction curve
- Historical durability analysis across multiple power outputs, durations, and race scenarios
- Phenotype to training prescription: Diesels, Puncheurs, Sprinters, All Arounders, Specialists and GC riders need different types of training.
Put those connectors together, and the headline capability is this: we can analyze 10 years of an athlete’s historical data, tell them exactly what their power outputs are today, predict what they can be, and give them specific training guidance to get there.
That’s the difference between a coach with a chart and a coach with AI. The AI stops describing the past and starts predicting and prescribing the future.
An Olympic champion arrived at the same insight
It’s not just team programs heading this way. Athletes are too, and the smart ones are leading.
Kristen Faulkner, an Olympic road race gold medalist, recently shared that she’d spent two months building her own AI system to analyze her body. She integrated heart rate, HRV, sleep, power, temperature, menstrual cycle phase, and bloodwork across 4,400 hours of training history, and used the system to prepare for the Pan American Championships, where she won three gold medals and posted her best-ever 20-minute power on the day. Her stated requirement was that every output had to be “actionable, not just interesting.”
That principle is exactly right. AI on cycling data only matters when the output changes what you do tomorrow. A pattern is interesting. A prescription is performance.
I commented on Kristen’s post because we’ve been building toward the same goal from a different starting point: 20 years of coaching expertise feeding the model the physiological relationships to look for and our coaching expertise of what works. Kristen built a system trained on one body. We’ve trained ours on the principles that produce breakthroughs across thousands of athletes from World Tour to amateurs. Both approaches converge on the same conclusion: AI is most powerful when it’s been told what to look at by someone who already knows.
That’s the part of the AI conversation that doesn’t get enough airtime: knowing which physiological relationships matter, and how to weigh them against each other. It’s not a question Claude or GPT alone can answer. It’s a question that takes a trained AI model to answer. Once you have the aggregate data plus the trained framework, the AI delivers real insight to every athlete, every day, at scale.
In short: the dataset gets you to the starting line. The expert who tells the AI what to analyze gets you to the podium.
Here’s how this analytical capability looks at the very top of the sport.
A predictive example: 2026 Tour de France Stage 20
Stage 20 of the 2026 Tour de France is the queen stage and almost certainly the most decisive day of the entire race. 171km from Le Bourg d’Oisans, 5,600m+ of vertical, the only stage in the race over 5,000m. The menu: Croix de Fer → Télégraphe → Galibier → Col de Sarenne → Alpe d’Huez. By the time the GC contenders touch the base of Alpe d’Huez, they’ll already have roughly 4,500m of climbing in their legs and 3,032km of racing already in their bodies from the previous 19 stages.
How would we use AI to analyze the performance and the training that it will take to win? In layers.
Layer 1: Peak power up Alpe d’Huez. The obvious starting point. What’s each GC contender’s predicted ascent power up the final climb? That comes from modeling each rider’s best 30-to-45-minute power outputs, scaled to W/kg on the day.
Layer 2: Power output under fatigue. This is where Layer 1 falls apart for most of the field. The relevant question isn’t what a rider can hold up Alpe d’Huez fresh. It’s what they can hold after 19 stages of racing and four hard climbs in the same day. That’s a durability question; how much power does this rider sustain at threshold and above once they’re 3,000, 3,500, 4,000+ kJ deep into a stage?
Furthermore, how does their recovery across the previous three weeks factor in? What recovery metrics do they need to hit in weeks one and two to thrive in week three?
Some riders barely fade. Others lose 10–15% of their threshold. That difference wins and loses Tours.
We can run a historical analysis on each GC contender’s data, particularly their previous Tours de France dataset, and quantify exactly how their power decays as kJs accumulate within a stage. That produces a fatigue-adjusted power prediction for the final climb. Not a fresh-leg fantasy.
Layer 3: GC modeling. Now combine the two. Given the race situation entering the stage, we can model the power output a contender needs to hold on Alpe d’Huez to (a) close a specific GC time gap, or (b) defend a specific GC lead. Accounting for likely GC dynamics on the 4 previous climbs, the energy costs, and the rider’s historical fatigue profile, does the math say the deficit is closeable? Is the lead defensible? At what wattage, and for how many minutes? How far from the top does the rider need to attack and hold what wattage? How does this change team tactics? If the model predicts the rider can’t make up a GC deficit, that’s exactly the kind of knowledge a Directeur Sportif and a team’s performance staff want before the stage starts.
Know this: these are exactly the types of questions that properly trained AI models can answer very well and in real time.
That said, analyzing peak power is the easy part. Prescribing the exact training a rider needs to meet those demands 11 months in advance is the secret sauce. The durability work, the fatigue resistance, the balance of training and race volume against a rider’s recovery kinetics. That’s the marginal gain that will unlock the next Tour de France winner.
The exciting part is that these same analytical capabilities aren’t limited to World Tour teams. The exact same physiological relationships that help predict a GC contender’s durability on Alpe d’Huez can help a Masters athlete understand why their FTP plateaued, why their recovery stalled, or where their next 10–20 watts are hiding. The scale changes. The physiology doesn’t.
Coming Next. Three follow-ups in this series:
- The FTP Report. How CoachCat ingests every Strava file you’ve ever uploaded and shows you exactly what your FTP is today, what it can be, your durability, your phenotype, and where the next watts are hiding.
- Talent ID. Pattern recognition from multi-year datasets of junior cyclists who turned pro, with separate models for junior men and junior women. The kind of early signal national federations, development squads, and U23 programs can leverage.
- Recovery Optimization. Exactly how much higher your FTP can climb if you sleep, eat, and recover better.