

Every FTP test protocol depends on the one thing that is really hard (and unpleasant) to do: truly go as hard as you can.
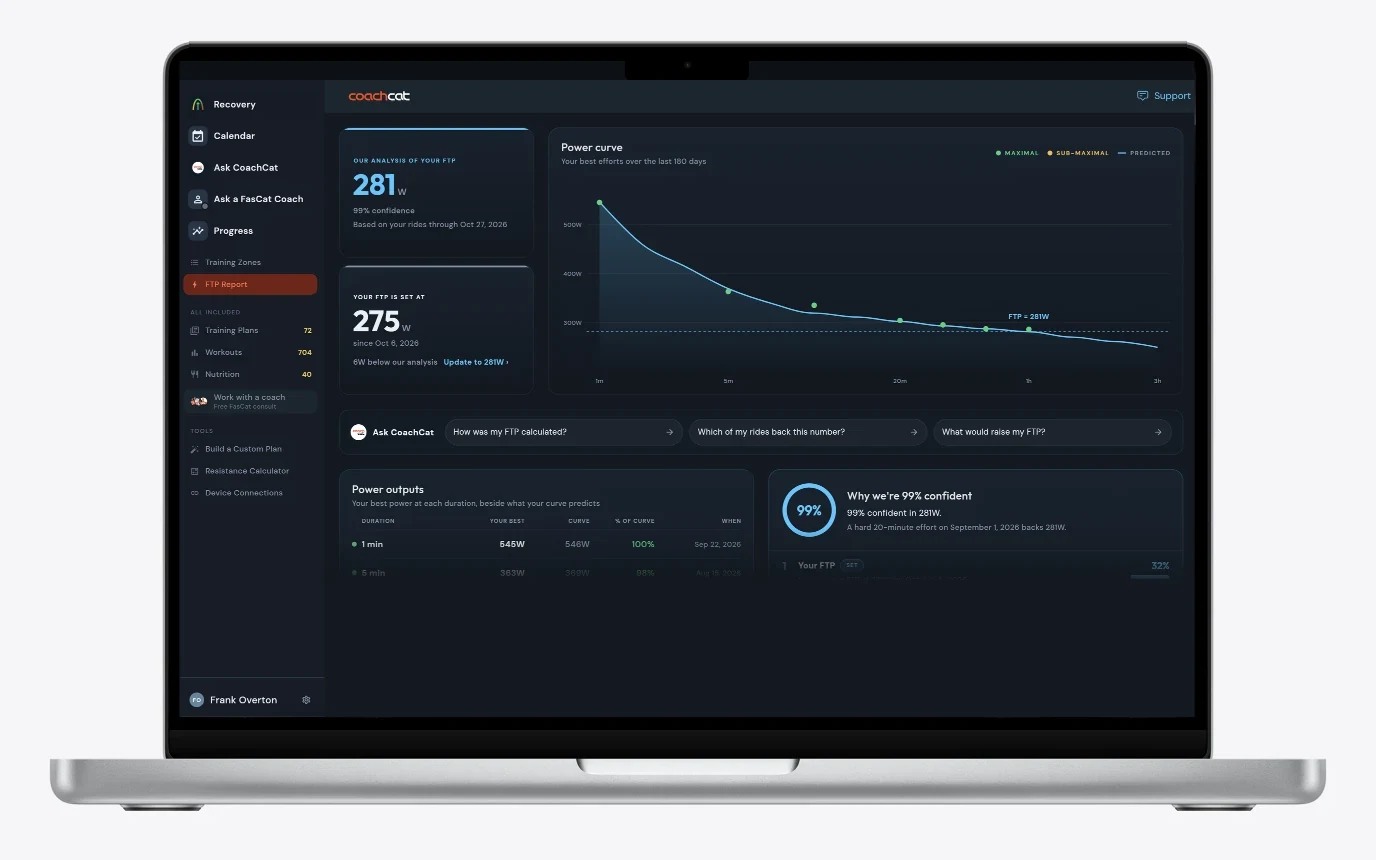
The new FTP Tracker in CoachCat solves that problem for you with your existing power data. Plus, our AI analysis also uses your heart rate to read how hard each effort really was, and your Level (CoachCat's daily measure of how much you have been training) to bring the number to today. No test is required to get your number, although hard efforts make your FTP determination more accurate.
Key Takeaways
- Every FTP test, and the critical power curve, needs a truly maximal effort, and most riders' files are nearly empty of them.
- CoachCat reads every effort against your heart rate, so hard but not maximal rides still help find your FTP.
- We use your Level (training load) to bring older efforts to today. When you have trained less since your best efforts, the number comes down gradually. It goes up when a ride shows it.
- Every number comes with a degree of confidence, and the Tracker tells you when one hard effort would raise it.
01 · The problem
The Problem: Going as Hard as You Can
An FTP test means going as hard as you possibly can, on purpose, and it hurts.
That is the first problem. The 20 minute test, the ramp test, the 8 minute test, the full hour: each one asks you to empty the tank. So you dread it. Your legs don't feel great, it's cold, it's windy, you hate going hard on the trainer, you will do it next week. Every excuse you have ever used to skip a race works just as well for a test.
Execution is the next hurdle. Start too hard and fade. Start too easy and leave watts on the table. Sleep badly the night before. Each one gives you a number that is wrong, and not a little wrong. Wrong enough to set every training zone you ride for the next eight weeks too low or too high.
A maximal effort is hard to produce on demand. That is the problem. It is why most athletes test rarely, test poorly, or skip testing altogether and ride on an FTP that is months out of date.
The critical power curve looks at every ride, not one test.
Instead of betting everything on one test on one day, the critical power curve plucks out your best power outputs at every duration, from 5 seconds to 60 minutes and beyond, from all of your rides, not a single day. It rests on sixty years of exercise physiology, from Monod and Scherrer's original work capacity model to today's power duration research1 to 7.
- No single effort carries the whole load. The curve smooths out the bad days.
- It finds the shape of what you can actually do.
Critical Power curves still need maximal efforts to be accurate.
Same problem, different costume. The curve is only as good as the data points that build it, and it cannot tell a hard effort from a maximal one on its own.
- The group sat up at 4 minutes. Your hardest 5 minute effort was a surge that ended early, so the curve sits below your real ability at 5 minutes.
- The climb topped out at 3:40. Your best 5 minute power is 3:40 of climbing plus 80 seconds of coasting, and the curve calls it your 5 minute best.
- No true 20 minutes since spring. The curve at 20 minutes describes the athlete you were in spring.
In the language of the science, the problem is an incomplete data set. The model needs maximal efforts at several durations to find the shape of the curve. A rider might have an honest 20 minute effort from a club time trial and no honest 5 minute effort in months, because nobody goes all out for 5 minutes by accident. Fit the curve to that and the short end is wrong, which pulls the long end out of shape too.
Even a perfect curve describes the days those efforts happened.
Fast in July, and three easy weeks since. The curve still says July. Your FTP goes up with training and down without it, and a curve built from past efforts cannot see what you have done since.
Two tools, one missing ingredient
Most riders' power files are full of hard efforts and nearly empty of truly maximal ones. So you end up with two tools that both depend on the one thing athletes reliably fail to provide, and neither one knows what day it is.
| Method | What it needs | What goes wrong | What it costs you |
|---|---|---|---|
| 20 minute test | One all out 20 minutes, then 95 percent | Paced wrong, or 4 percent too easy. The multiplier is wrong for diesels one way and punchy riders the other. | Eight weeks of zones set too low or too high |
| Ramp test | Ride to failure on a rising ladder | Rewards a big sprint, punishes a big engine | An FTP that does not match the hour |
| 8 minute test | Two maximal 8 minute efforts | Easy to leave something in the tank on the second one | Same as above, with more suffering |
| Full hour | One maximal 60 minutes | Almost nobody does one outside a race | Months between real numbers |
| Critical power curve | Maximal efforts at several durations, from any rides | Hard efforts and maximal efforts look the same to it, and most files are missing the short ones | A curve that describes the athlete you were, not the one you are |

Most riders' power files are full of hard efforts and nearly empty of truly maximal ones. The curve cannot tell the difference on its own. That is the whole problem in one sentence.Frank Overton FasCat founder, former Cat 1 racer, invented sweet spot training in 2005
02 · The solution
The Solution: We Analyze Your Data and Tell You Your FTP
CoachCat analyzes and learns the relationship between your power and your heart rate to help determine your FTP.
Heart rate is the honesty check. Once CoachCat has learned your threshold heart rate, it can tell which of your long efforts were truly all out and which hard efforts you held back on. Every effort is read for what it was.
- Say your best hour lately was 240 watts with your heart rate short of threshold. That was hard, but you held back. When you have not gone all out lately, CoachCat can credit that effort above the watts it shows, never past what your hardest real effort supports.
- An easy effort keeps its watts. It earns no extra credit, and it does not pull your number down either.
That is how hard but not maximal riding helps with the incomplete data set. An all out effort sets the ceiling, and a hard effort you held back on still tells CoachCat something when all out efforts are scarce. Heart rate is how it knows which is which.
It learns your threshold heart rate from your own rides.
There is nothing to type in and nothing to get wrong. The Tracker does not use the threshold heart rate in your profile, which still sets your heart rate zones. It learns its own from the hardest efforts in your rides with a heart rate monitor strap, once there are enough of those rides to go on. Threshold heart rate holds steady within a season even as your power changes, which makes it a stable reference against which every effort can be read.
Because it comes from your hardest efforts, steady tempo and sweet spot rides do not move it, and if you rarely go hard CoachCat has less to learn from. Until it has learned your threshold heart rate, the Tracker works from power alone. The Tracker will tell you when one hard effort would raise its degree of confidence in your number.
FTP is the power your curve says you can hold for 60 minutes.
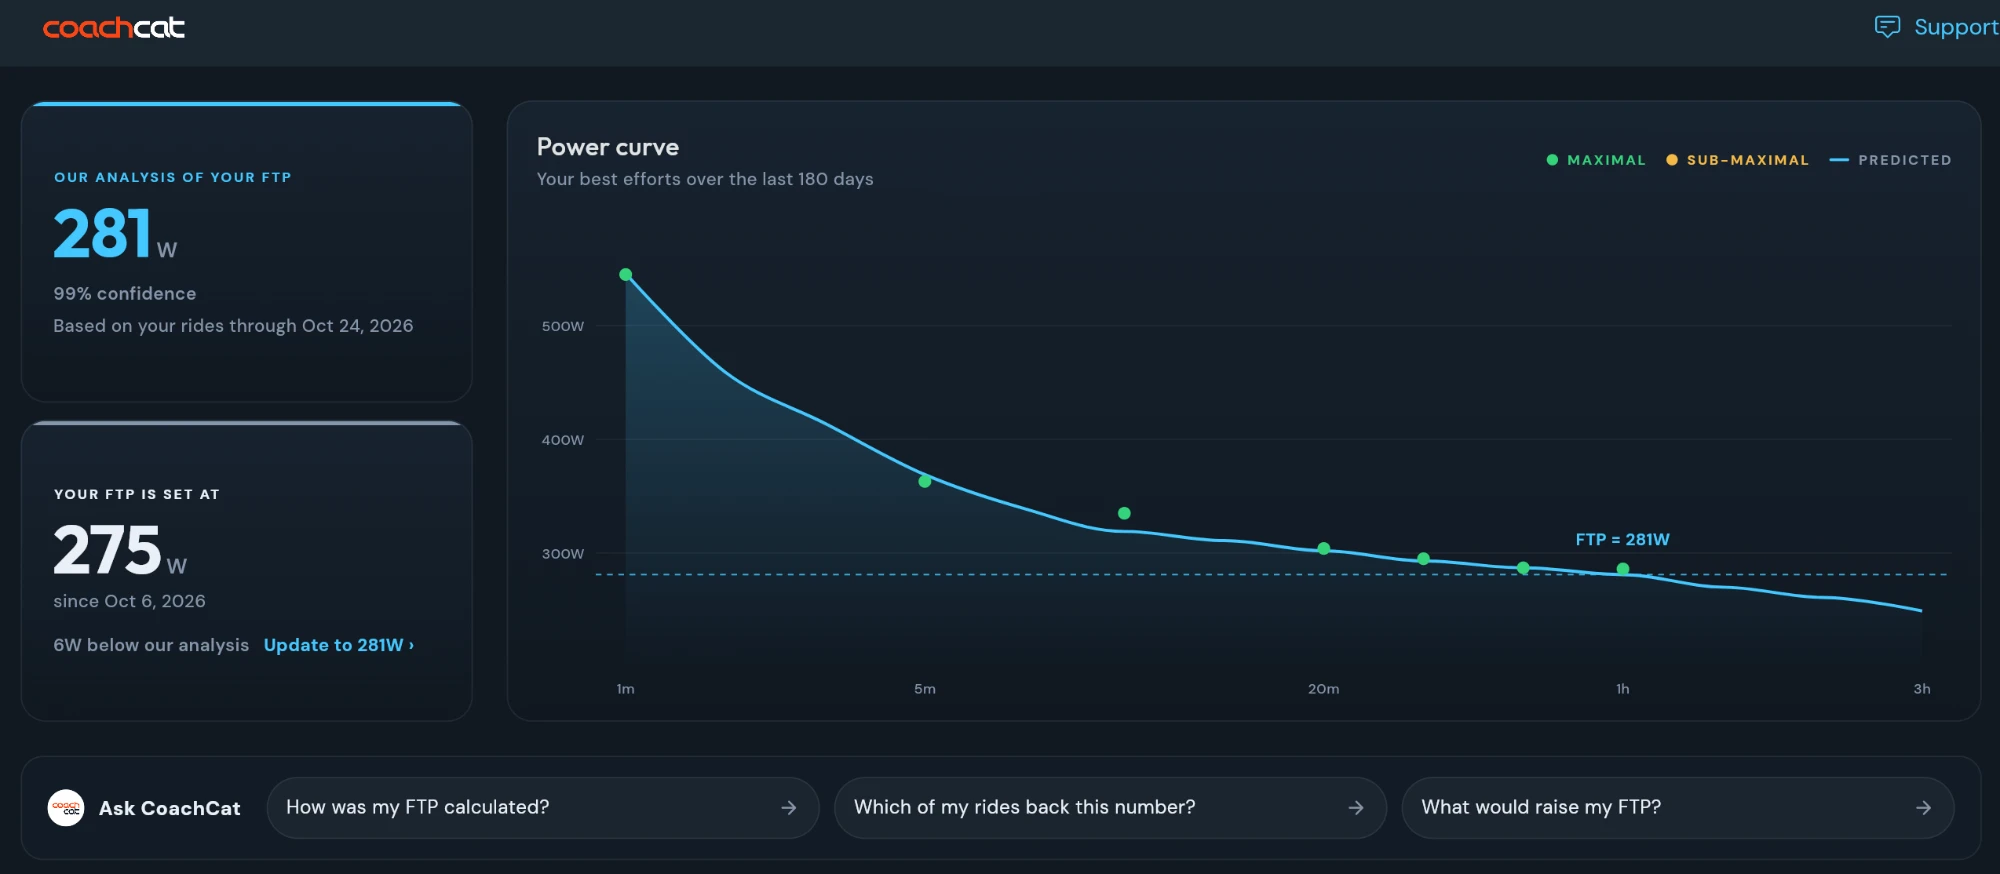
That is what FTP has always meant, the best you can do for an hour. CoachCat fits your power curve from your best efforts between 1 and 60 minutes, and your best hard 20 minutes of the last six months sets the ceiling: the number never goes above what that effort supports for the kind of rider you are. A punchy rider's 20 minutes carries more short, hard work than a diesel's, so it supports a little less. That is the fix for Exhibit 2, and for many riders the result lands close to what a well paced 20 minute test would give. Once heart rate shows a 40 or 60 minute effort was truly all out, that longer effort can anchor the number instead.
What changes when heart rate joins the curve
A power only curve sees watts. With heart rate beside them, every effort gets read for what it was.
| The ride | A power only curve sees | With heart rate, CoachCat sees |
|---|---|---|
| A hard 20 minutes with heart rate at threshold | Your 20 minute best | A maximal effort. The watts are real, and your best one sets the ceiling. |
| An hour at 240 W, heart rate a little below threshold | Your 60 minute best, taken at face value | A hard effort you held back on. When you have not gone all out lately, it can earn credit above 240 W, never past what your hardest real effort supports. |
| A long sweet spot ride at a known heart rate | A point on the long end of the curve | An effort that keeps its watts. Long rides back your degree of confidence, but they do not stand in for an all out effort. |
| Climbs separated by descents | A 20 minute best that includes coasting | An effort whose heart rate never settled near threshold. Discounted. |
| Power far higher than your heart rate supports, against your own recent rides | A breakthrough | A power meter fault. Left out of the analysis, with a note. |
Every number comes with a degree of confidence.
CoachCat does not just hand you a number. It tells you how much evidence sits behind it. An FTP you have set, a best 60 minute effort that sits on your power curve, enough all out efforts to fit one consistent curve, a history of accepted FTPs, and long rides: that is a high confidence number. A hard 20 minute effort near the number raises it. Months without one, or rides that contradict the number, lower it: the number still stands, but CoachCat says so, and tells you what would raise its confidence. Usually that is one hard effort. Here is what that breakdown looks like for one rider.
- 1Your FTP SetYou set your FTP at 260W on October 27, 2026.32%
- 2Sustained 60 minute power 60 minYour best 60 minute effort of 234W sits on your power duration curve.24%
- 3Power duration fit Curve7 maximal efforts fit one consistent power duration curve.18%
- 4FTP history TrendNot enough accepted FTP values to show a trend yet.14%
- 5Durability Long ridesRides over two hours back the durability signal.12%
This is the same engine we used to analyze a full season of a WorldTour team's power data.
03 · Level
Level: Bringing the Number to Today
The curve knows July. Your Level knows today.
A critical power curve, even a perfect one, only describes your fitness on the days those efforts happened. Heart rate fixes which efforts count. It cannot tell you what has happened to you since.
Level is CoachCat's daily measure of your training load. It moves every day whether or not you test, so it is the one signal that knows what you have done since your last hard effort.
There is a clear relationship between your Level and your FTP.
The more you ride, the faster you get, up to a point13, 14. We have a training tip on it, and Exhibit 5 shows the shape of a season.
- Through a base phase your Level climbs and your FTP climbs with it. That is the sweet spot base doing its job.
- A recovery week dips your Level without costing you fitness, and CoachCat knows the difference.
- Once intervals start, your Level holds and your FTP keeps rising. That last stretch is why the Tracker raises your number only when a ride shows it, never from Level alone.
Your Level brings your older efforts down to today.
Your FTP goes up with training and down without it. When the curve's data has aged, CoachCat compares your Level now with your Level when those best efforts were set.
- Level lower than when your best efforts were set: those efforts count for a little less, so your number comes down. A hard 20 minutes from the spring, set at a much higher Level than today, still counts, but for what you can do today, not what you could do then.
- Level higher than when your best efforts were set: your number holds. Training more makes you fitter, but Level never raises the number on its own. It goes up when a ride shows it, such as a new best hard 20 minutes.
- How much it comes down follows one rule that is the same for every rider, and it is small on purpose.
CoachCat also notes whether a recent hard 20 minute effort backs your number. When months go by without one, the number holds, your degree of confidence comes down a little, and the Tracker tells you a hard 20 minute effort near your number would raise it. When none of your rides in the last six months reaches the number, the Tracker calls it an estimate and says a 20 minute all out effort would confirm it.
04 · How we do it
How We Do It
The analyses under the hood, in plain language. Then all four factors and the guardrails in one place.
1. Every duration counts, and your best hard 20 minutes sets the ceiling.
CoachCat fits your power curve from your best 1, 5, 12, 20, 30, 40 and 60 minute efforts.
- A hard climb on Saturday and a race on Sunday both feed the number. You do not have to schedule a test.
- Your best hard 20 minutes of the last six months sets the ceiling. The number never goes above what that effort supports for the kind of rider you are. Only a hard, steady 20 minutes counts.
- A maximal 40 or 60 minutes can anchor the number instead, once heart rate shows the effort was truly all out.
2. Heart rate decides how much to trust each effort.
Every best effort in your file is read against the heart rate behind it.
- Heart rate at or near threshold: the effort was maximal. The watts are real, and a long effort like this can anchor the number.
- Hard, but held back: when you have not gone all out lately, the effort can be credited above the watts it shows.
- Easy: the effort keeps its watts. It earns no extra credit, and it does not pull your number down.
- Heart rate never settled, like a climb broken up by descents: the effort is discounted.
One rule holds throughout. Whatever credit heart rate adds, it never goes past the ceiling. Your hardest real effort sets the limit on what the curve can say.
3. Heart rate catches a broken power meter.
Your watts at a given heartbeat are remarkably consistent, ride to ride. When a meter starts reading far higher than your heart rate supports, measured against your own rides around it, that is a fault, not a breakthrough. Those rides are left out of the analysis and the Tracker tells you so.
How the FTP Tracker works, on one page
Four factors, each with a job, and a set of guardrails that keep the number from moving for the wrong reasons.
| Factor | What CoachCat looks at | What it protects against |
|---|---|---|
| Every duration | Your best efforts from 1 to 60 minutes, from any ride, with your best hard 20 minutes of the last six months as the ceiling | Betting everything on one test on one day |
| Heart rate | Which long efforts were truly all out, and which hard efforts you held back on | A held back effort being read as your limit, and a long effort being trusted before it has earned it |
| Power at a given heart rate | Whether your watts per heartbeat match your history | A faulty power meter being read as a breakthrough |
| Level | Your training load now versus when your best efforts were set (Chapter 3) | A number that still describes July when you have trained less since |
The guardrails
- Your number goes up when a ride shows it: a better effort than the ones behind it, up to what your best hard 20 minutes of the last six months supports. Training load alone never raises it.
- It comes down for three reasons only: a steady, all out 20 minutes that supports less, two all out efforts on different days that agree with each other, or a Level that has stayed down since the number was set. Anything else and the number holds. It does not drift down because time has passed. Your degree of confidence is what falls then.
- A rest week or a taper is not a layoff. The number comes down only when your Level has fallen for long enough to mean lost fitness, and then it comes down the way fitness actually leaves the body: gradually, not in one cliff.
- Level only brings the number down, never up, by one small rule that is the same for every rider. The Level section above has the whole story.
- One off day does not reset it. A weaker effort lowers the number only when it was steady and all out for 20 minutes, or when a second all out effort on another day agrees with it.
- Saving a new FTP starts the analysis again from that number, and it moves with the rides you do after it.
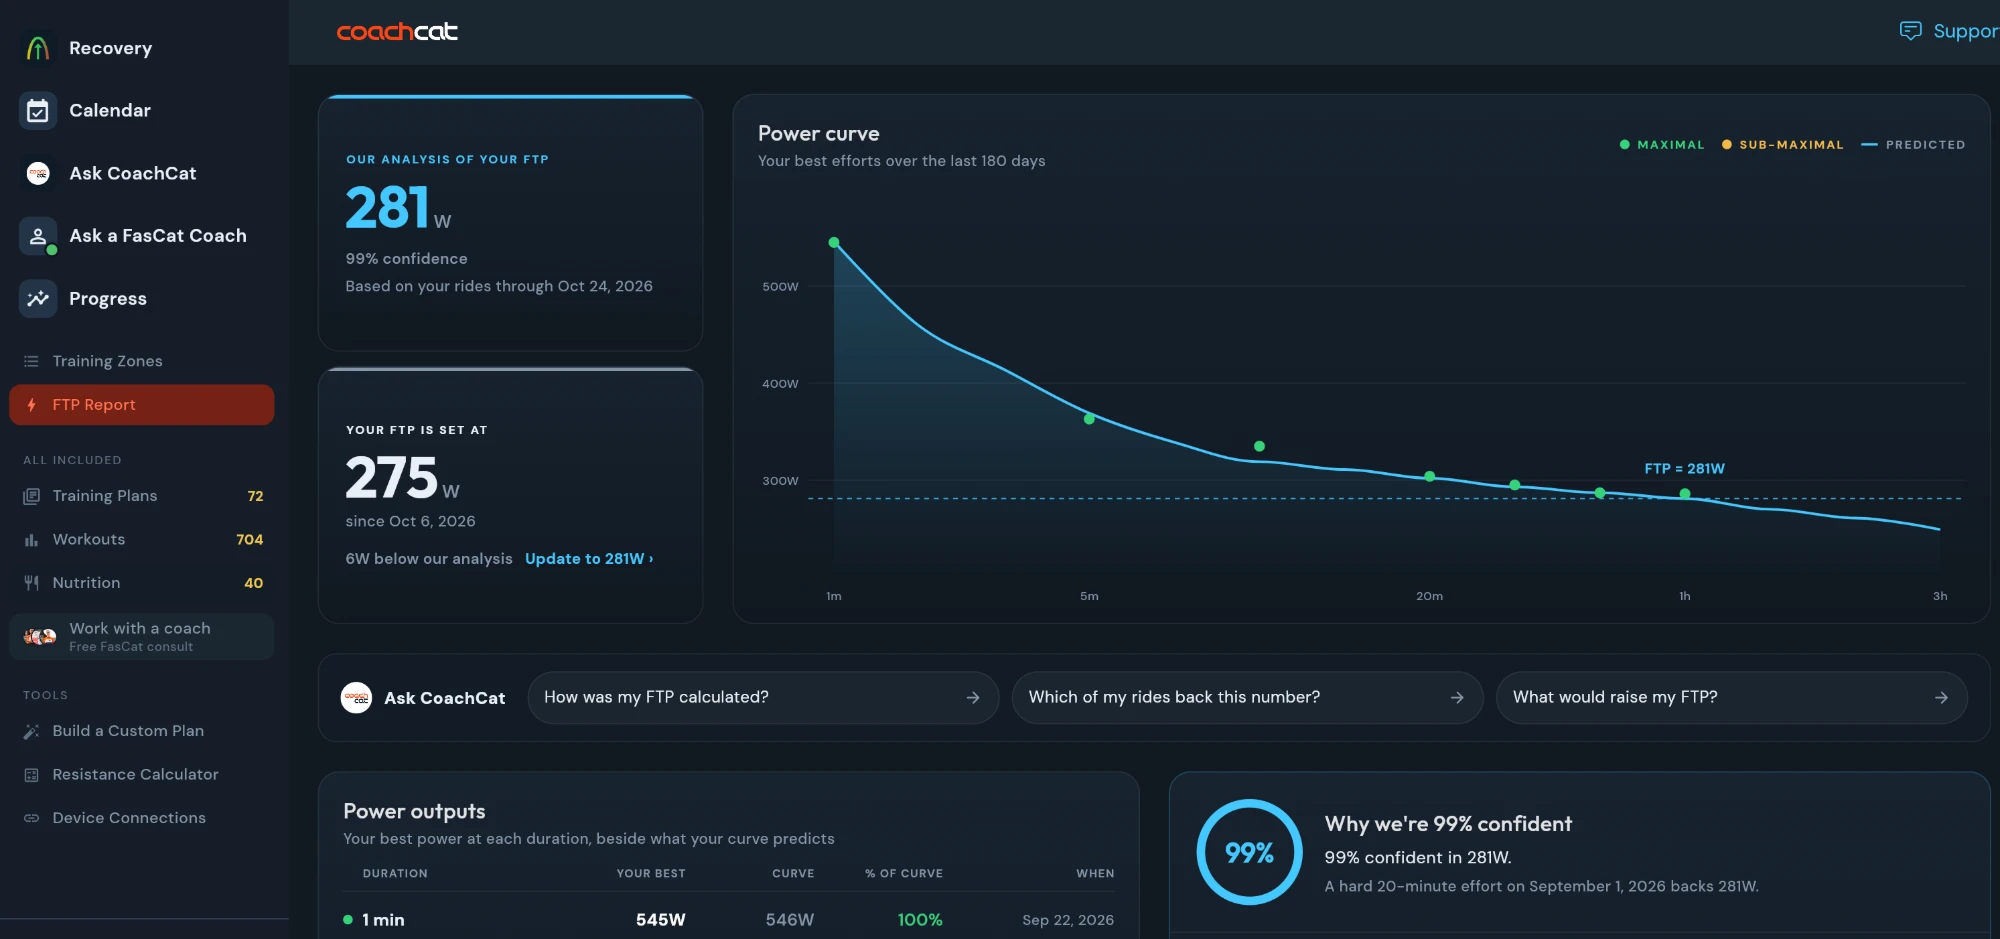
A true maximal effort still raises your degree of confidence, and the Tracker will tell you when one is overdue. The difference is that you no longer have to manufacture one on a Tuesday in order to know where you stand.Frank Overton FasCat founder, former Cat 1 racer, invented sweet spot training in 2005
Now go see your number
Keep riding. The Tracker is built from your data, so the more you ride, and the harder you go when the workout calls for it, the higher the degree of confidence behind your number.
Open the FTP Tracker, compare the FTP our analysis determined with the one set in your profile, and update it in one tap.
See my FTP Tracker →Sync your rides and CoachCat determines your FTP from the riding you have already done, sets your training zones, and gives you a benchmark to measure every improvement from here. No test required.
Start a free trial →05 · References
References
CoachCat uses a combination of scientific approaches: the critical power model, heart rate, training load, and the common FTP testing protocols. The critical power model dates to 1965, its use with everyday ride data has been validated in the field, and the gap between 95 percent of 20 minutes and a true hour has been measured three times over. The small orange numbers in the exhibits point here.
The critical power model
Where the curve comes from: the original work capacity model, the link to the anaerobic threshold, and the modern reviews that define critical power as the boundary between sustainable and unsustainable exercise.
- Monod H, Scherrer J. The work capacity of a synergic muscular group. Ergonomics. 1965;8(3):329-338. doi:10.1080/00140136508930810
- Moritani T, Nagata A, deVries HA, Muro M. Critical power as a measure of physical work capacity and anaerobic threshold. Ergonomics. 1981;24(5):339-350. doi:10.1080/00140138108924856
- Morton RH. The critical power and related whole-body bioenergetic models. European Journal of Applied Physiology. 2006;96(4):339-354. doi:10.1007/s00421-005-0088-2
- Jones AM, Vanhatalo A, Burnley M, Morton RH, Poole DC. Critical power: implications for determination of VO2max and exercise tolerance. Medicine & Science in Sports & Exercise. 2010;42(10):1876-1890. doi:10.1249/MSS.0b013e3181d9cf7f
- Poole DC, Burnley M, Vanhatalo A, Rossiter HB, Jones AM. Critical power: an important fatigue threshold in exercise physiology. Medicine & Science in Sports & Exercise. 2016;48(11):2320-2334. doi:10.1249/MSS.0000000000000939
Critical power from everyday rides
Evidence that a valid curve can be built from training and racing data rather than a laboratory, and the current consensus on power profiling in cycling.
- Karsten B, Jobson SA, Hopker J, Stevens L, Beedie C. Validity and reliability of critical power field testing. European Journal of Applied Physiology. 2015;115(1):197-204. doi:10.1007/s00421-014-3001-z
- Leo P, Spragg J, Podlogar T, Lawley JS, Mujika I. Power profiling and the power-duration relationship in cycling: a narrative review. European Journal of Applied Physiology. 2022;122(2):301-316. doi:10.1007/s00421-021-04833-y
Why 95 percent of 20 minutes is not the hour
Three studies that compared the 20 minute shortcut with a real 60 minute effort or with critical power. Each found small average differences and wide individual ones, which is Exhibit 2 in one sentence.
- Borszcz FK, Tramontin AF, Bossi AH, Carminatti LJ, Costa VP. Functional threshold power in cyclists: validity of the concept and physiological responses. International Journal of Sports Medicine. 2018;39(10):737-742. doi:10.1055/s-0044-101546
- Morgan PT, Black MI, Bailey SJ, Jones AM, Vanhatalo A. Road cycle TT performance: relationship to the power-duration model and association with FTP. Journal of Sports Sciences. 2019;37(8):902-910. doi:10.1080/02640414.2018.1535772
- MacInnis MJ, Thomas ACQ, Phillips SM. The reliability of 4-minute and 20-minute time trials and their relationships to functional threshold power in trained cyclists. International Journal of Sports Physiology and Performance. 2019;14(1):38-45. doi:10.1123/ijspp.2018-0100
Heart rate as the honesty check
Threshold heart rate holds steady within a season even as power rises, and power at a fixed submaximal heart rate predicts performance. Both are why a strap lets CoachCat read how hard an effort really was.
- Lucía A, Hoyos J, Pérez M, Chicharro JL. Heart rate and performance parameters in elite cyclists: a longitudinal study. Medicine & Science in Sports & Exercise. 2000;32(10):1777-1782. PubMed 11039652
- Lamberts RP, Swart J, Noakes TD, Lambert MI. A novel submaximal cycle test to monitor fatigue and predict cycling performance. British Journal of Sports Medicine. 2011;45(10):797-804. bjsm.bmj.com/content/45/10/797
Training load
The systems model of training that underlies Level and every fitness and fatigue tracker since, and a field study in road cyclists showing that training load tracks the changes in fitness and performance that follow. The relationship between Level and FTP is Exhibit 5, in Chapter 3.
- Banister EW, Calvert TW, Savage MV, Bach T. A systems model of training for athletic performance. Australian Journal of Sports Medicine. 1975;7(3):57-61.
- Sanders D, Abt G, Hesselink MKC, Myers T, Akubat I. Methods of monitoring training load and their relationships to changes in fitness and performance in competitive road cyclists. International Journal of Sports Physiology and Performance. 2017;12(5):668-675. doi:10.1123/ijspp.2016-0454
Keep reading
- The 20 minute field test: if you want to add a true maximal effort, here is how to do it right.
- FTP versus critical power: where the curve came from and what it adds.
- Training load and FTP: why your Level and your FTP move together.
