Training data can get overwhelming fast.
Power. Sleep. HRV. FTP. OTS. Level. Streaks. Recovery. Zones. Charts. Graphs. Trends.
Sometimes it is a big ball of acronym WTF 🤷♂️
It is easy to start looking at everything and still not know what to do when you wake up, open CoachCat, and ask the question that really matters:
Should I follow or adjust the plan? Am I improving? Am I doing the right training?
At FasCat, we believe the best training metrics are the ones that help you make better decisions. Not just after a ride. Not just at the end of a training block. Every day.
That is why we focus on five key metrics inside CoachCat:
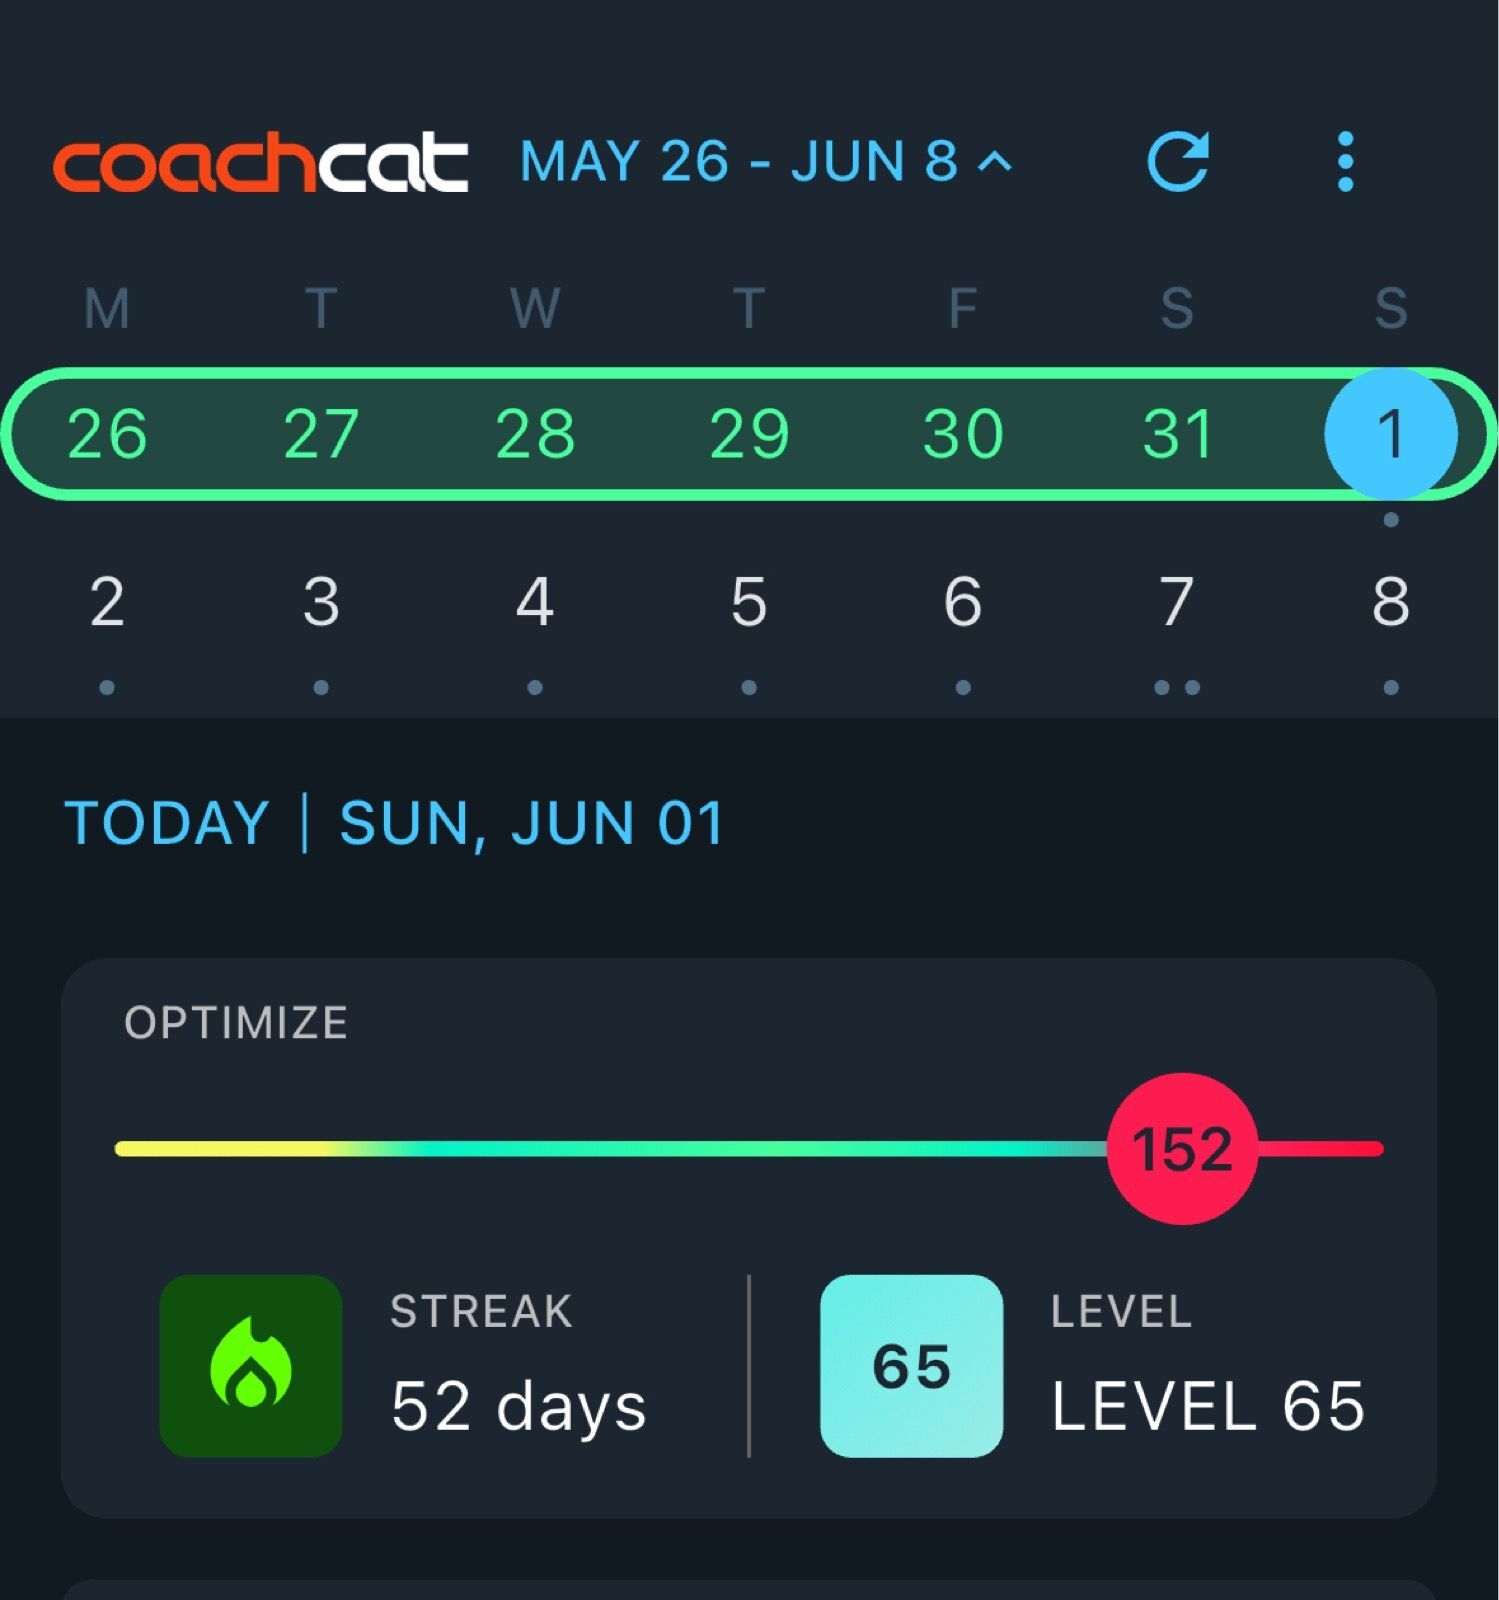
- Optimize Recovery Score
- Level
- Power PR’s
- Streak
- OTS
Together, these five numbers tell the story of your training, your recovery, your consistency, and your improvement. Plus, you do not need a masters degree in exercise science to understand.
1. Optimize Recovery Score: What Should I Do Today?
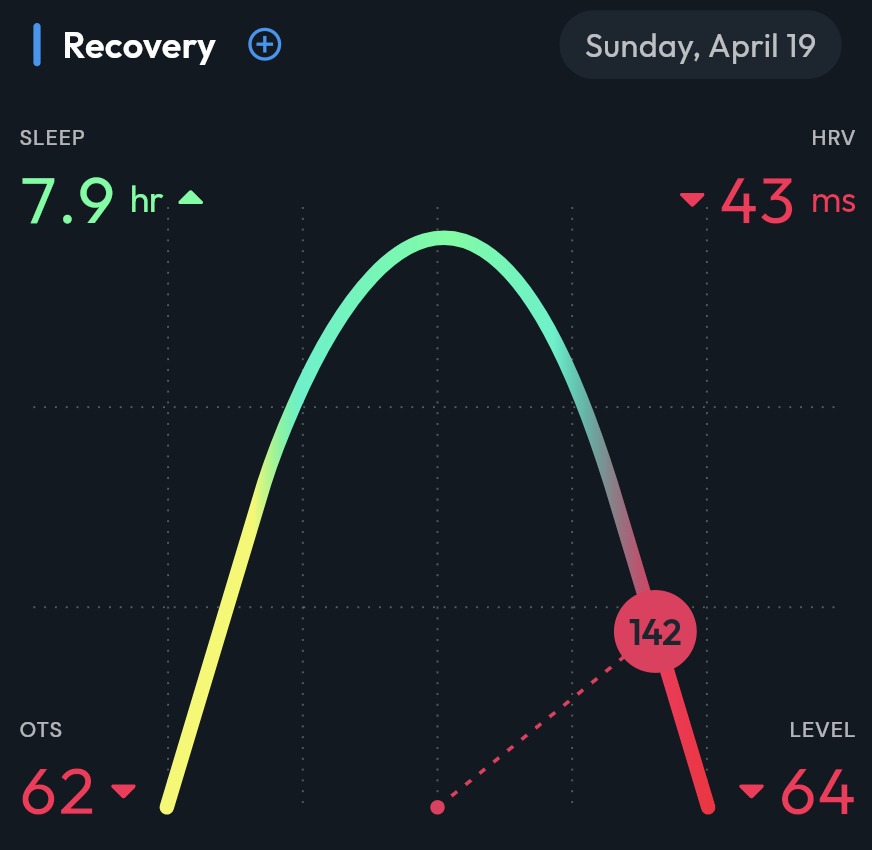
Your Optimize Recovery Score is the most important metric because it answers the most important question:
Are you ready to train?
CoachCat looks at your recent training stress, sleep, and HRV, to show the balance between your training and recovery. That balance is what determines whether today is a day to push, follow the plan, ride easier, or recover.
When your score is green, green means go. You are recovered enough to complete productive training.
When your score is yellow, you may need more consistent training. You have room to build.
When your score is red, your body is carrying more stress. That does not always mean panic. In fact, being in the red after a hard training block can be part of the plan. But if you stay there, or if you are deep in the red, recovery becomes the workout.
This is what makes the Optimize Recovery Score so useful. It does not just tell you what happened yesterday. It helps you decide what to do today. This is adaptive training at its finest.
Learn more about what the Recovery numbers mean here.
2. Level: How Fit Are You Right Now?
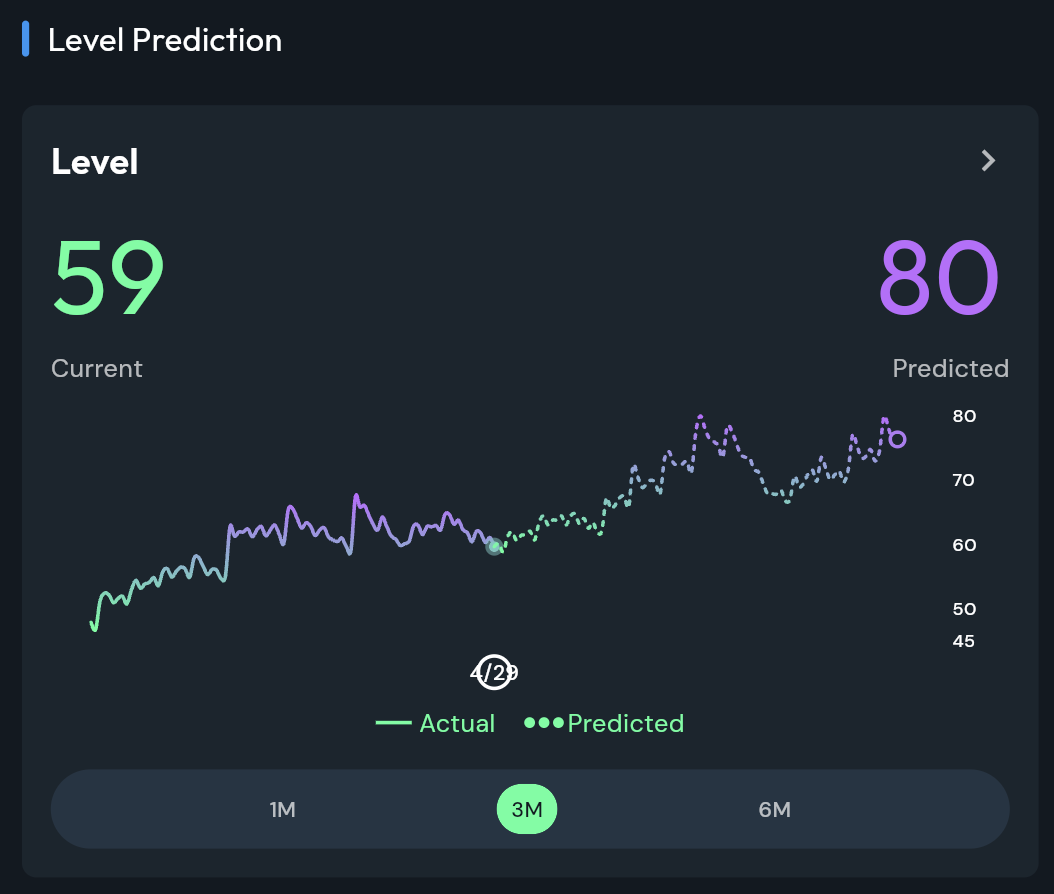
If Optimize Recovery Score is your daily decision metric, Level is your fitness trend metric.
Level shows how much quality training you have accumulated recently. It is calculated from a rolling 42-day average of your daily OTS, which gives you a simple view of your recent training load.
Ride more consistently, and your Level goes up. Ride less, and it comes down.
That is important because fitness is not built from one great ride. It is built through consistent training over time. Level helps you see that accumulation clearly.
During a build phase, a rising Level usually means you are doing the work required to improve. During a rest phase, Level may drop a bit while your body absorbs the training. That is not a problem. That is adaptation.
The goal is not to make Level go up forever. The goal is to raise it at the right time, recover at the right time, and arrive at your event with both fitness and freshness.
3. Power: Are You Actually Getting Faster?
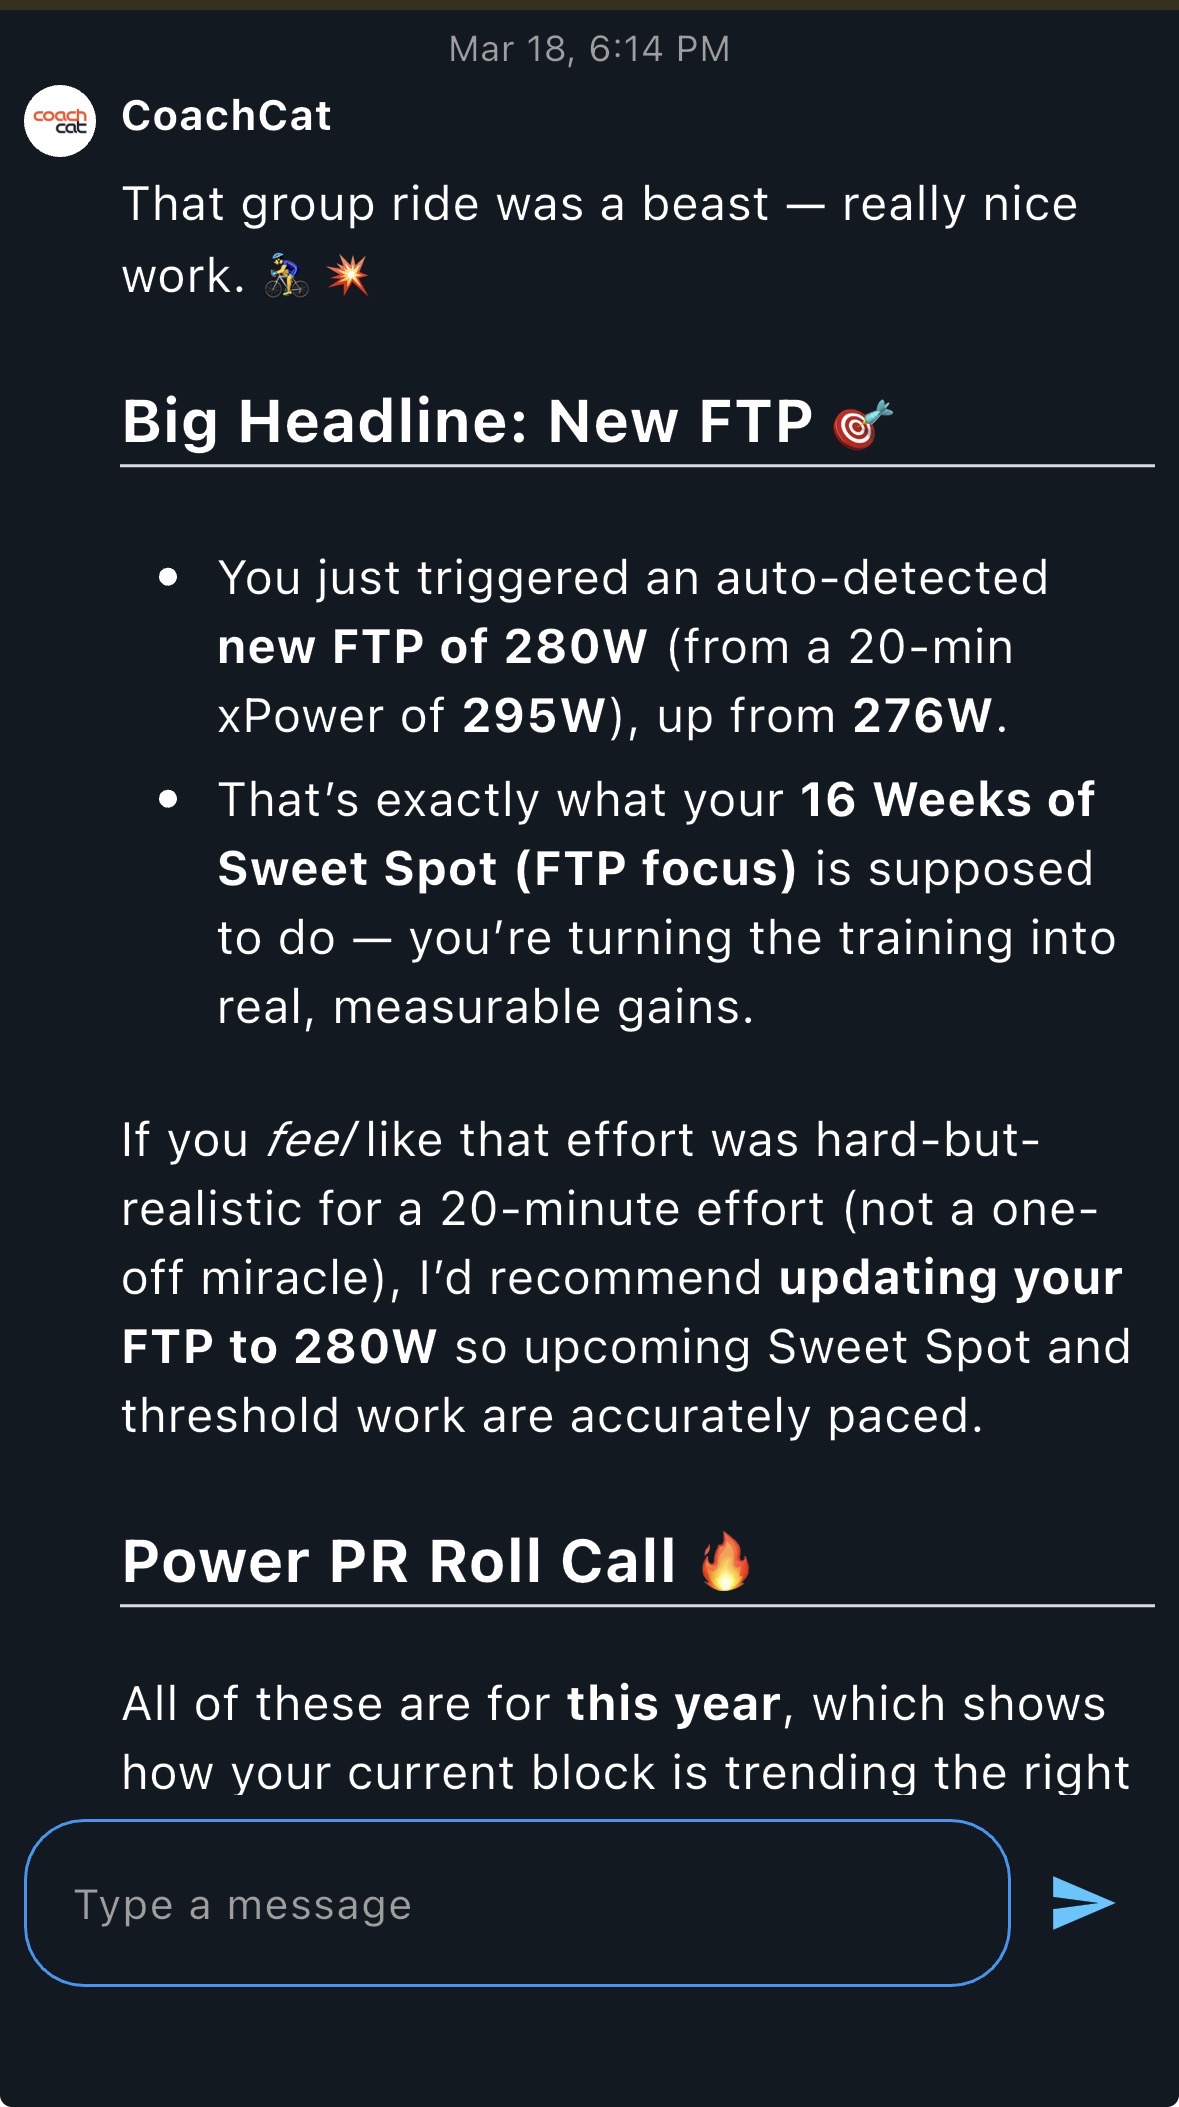
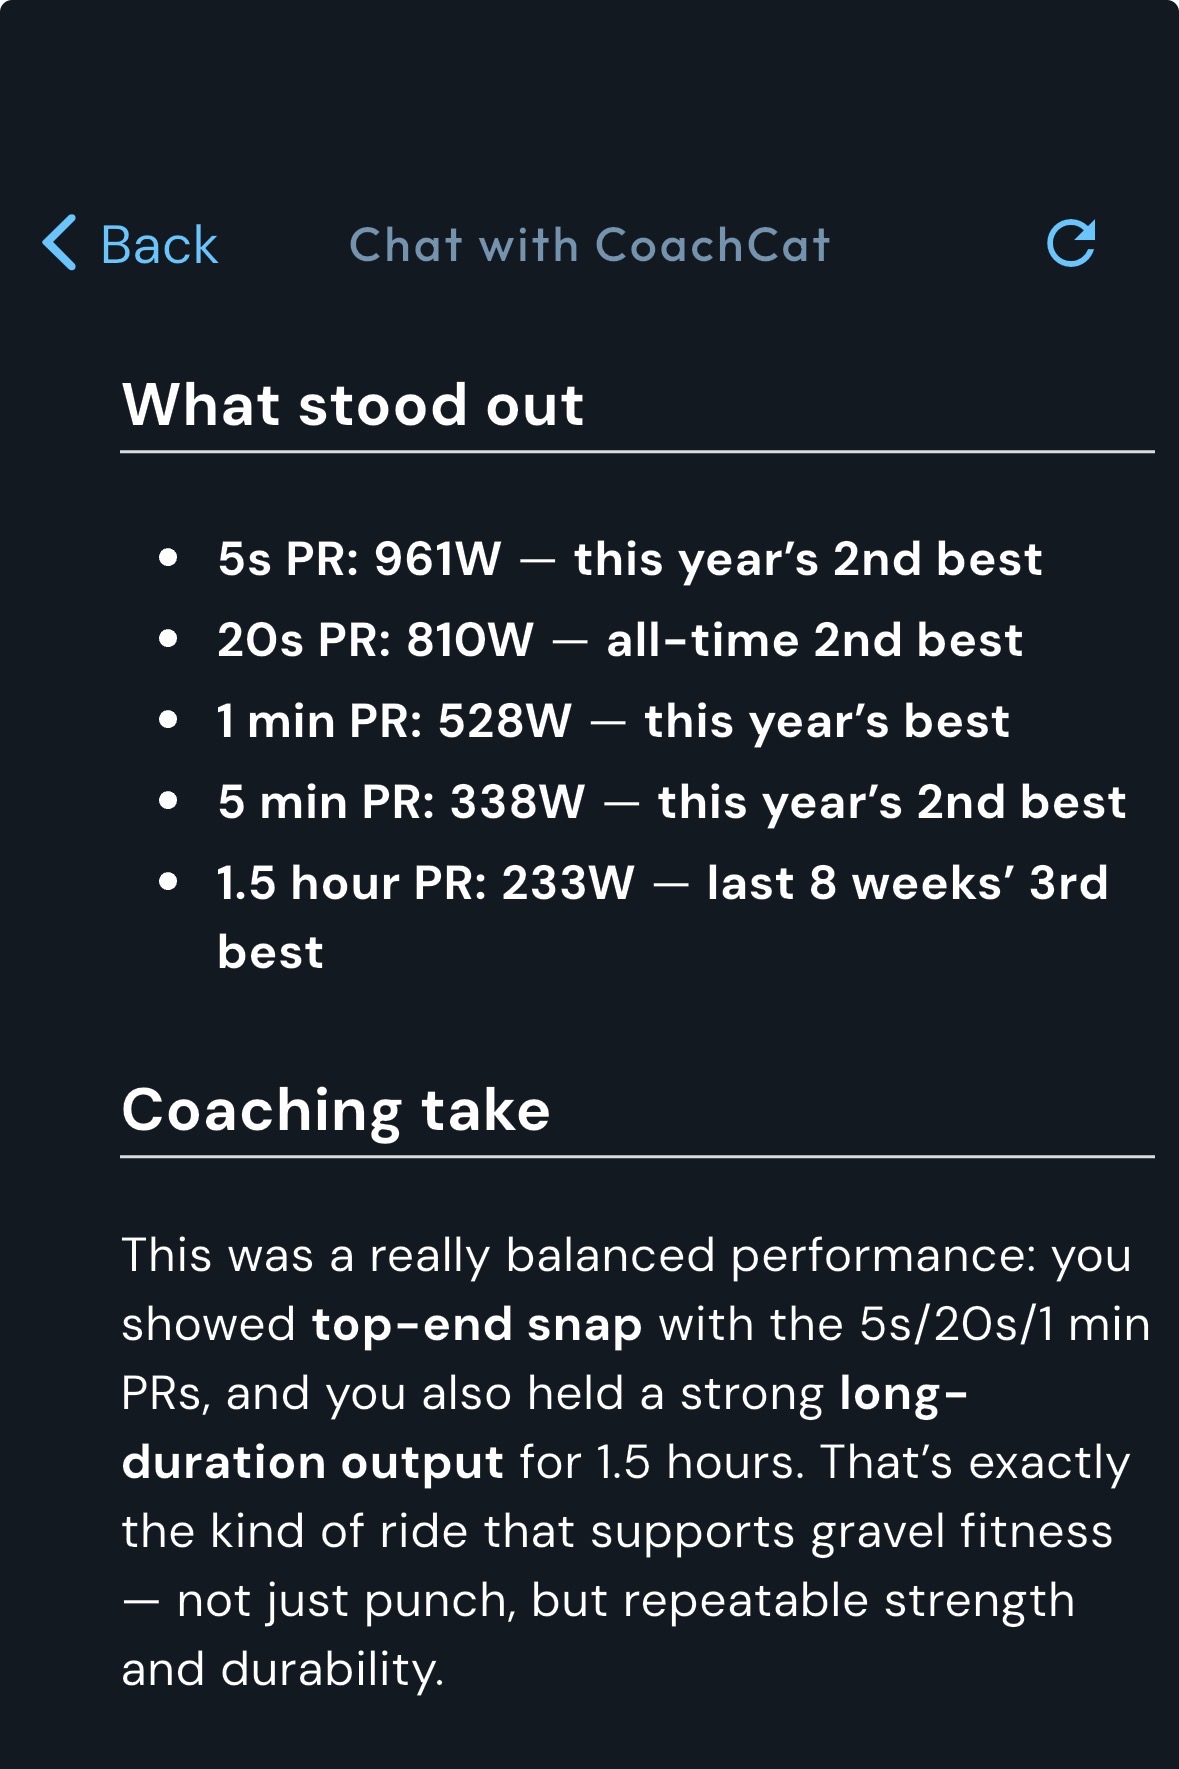
Power is the performance metric.
Your power meter tells you exactly how hard you are pedaling. That makes it one of the best tools for measuring improvement.
FTP is still one of the clearest benchmarks in cycling. If your FTP goes from 225 watts to 241 watts, you improved. That is real, measurable progress.
But power is not just about FTP tests. CoachCat can also use your ride data, races, group rides, and hard efforts to help detect improvements. Metrics like xPower can show what a ride felt like physiologically and help you understand your sustainable output.
Power answers questions like:
- Am I producing more watts than I used to?
- Are my intervals improving?
- Can I hold higher power for longer?
- Is my training actually making me faster?
That is why power remains one of the core metrics at FasCat. It turns effort into data, and data into better coaching decisions.
4. Streak: Are You Showing Up Consistently?
Consistency is the first pillar of getting faster.
Your Streak tracks how many days you have been following your plan, including rest days. That last part matters. Following the plan does not mean smashing yourself every day. It means doing the right thing each day.
- Some days that means Sweet Spot intervals.
- Some days that means Zone 2.
- Some days that means strength.
- Some days that means rest.
Your Streak rewards the habit of following the plan, not the mistake of training hard all the time.
This is powerful because most athletes do not fail because they missed one perfect workout. They struggle because their training becomes inconsistent. One missed day becomes three. A skipped recovery day becomes fatigue. A random hard ride replaces the workout that would have moved them forward.
Streak helps you stay engaged, accountable, and consistent.
And consistency is what turns training into improvement.
5. OTS: How Much Training Stress Did You Create?
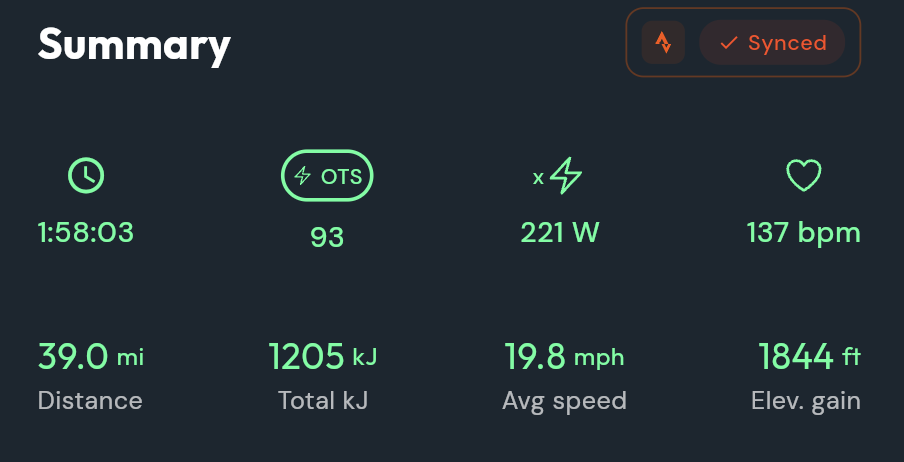
OTS stands for Optimized Training Stress.
Think of OTS as the training stress score for each ride, workout, or race. But unlike older stress metrics, OTS is designed to better reflect the true physiological cost of your training.
FasCat developed OTS to improve on traditional TSS by accounting for things that matter in the real world:
- Fatigue that accumulates during a ride
- Coasting time
That means a long ride where you encounter a lot of fatigue have higher OTS values. OTS gives a better picture of how much stress your body actually experienced.
OTS also feeds the bigger system. Your daily OTS contributes to your Level. It also helps CoachCat understand your training load and compare that load against your recovery data.
So while OTS is number five on this list, it is still foundational. It is the raw training stress input that helps make the other metrics more useful.
How These Metrics Work Together
The magic is not in any one number by itself.
It is in how the five metrics work together.
- Optimize Recovery Score tells you what to do today.
- Level tells you how much fitness you have been building.
- Power tells you whether your performance is improving.
- Streak tells you whether you are following the plan consistently.
- OTS tells you how much training stress you created.
That is the FasCat training system in a nutshell.
- Train enough to improve.
- Recover enough to adapt.
- Measure your progress.
- Stay consistent.
- Repeat.
The Bottom Line
You do not need to drown in data to get faster.
You need the right data.
At FasCat, we believe these five metrics give athletes the clearest path to improvement because they connect the two things that matter most: training and recovery.
When you use CoachCat to track your Optimize Recovery Score, Level, Power, Streak, and OTS, you are no longer guessing.
- You know when to train.
- You know when to recover.
- You know whether your fitness is building.
- You know whether your power is improving.
- You know whether you are being consistent.
That is how you train smarter.
And that is how you ride faster.
Start tracking your metrics today in the CoachCat app. Your first week is free.