
How to review your "season" using power data
Top athletes are always looking ahead and planning long term. One of the best ways of doing this is by taking time to look back at how your training went this year: what went right, what went wrong, and what edits might help you improve next year. Using power data to review your season is an invaluable tool. With TrainingPeaks, you can use these charts to lay out some quick metrics to track your season.
Training hours
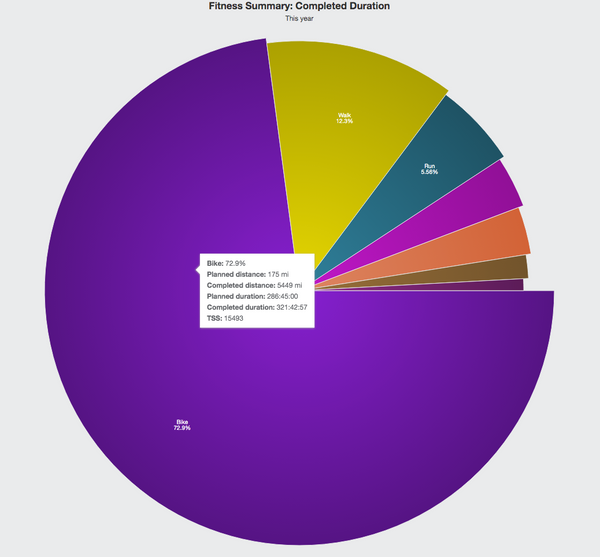
A simple first metric to look at when reviewing your season is how much time you put into training. In most cases, the more time you have to devote to quality training, the better you will be. Using the fitness summary tool (shown below), you can review total duration, TSS, distance, and comparisons to other disciplines. Take a look at how much total training you put in in 2022, but keep in mind that not all training is quality training.
To note the difference, also look at the “Time in Power Zones” chart to determine if you may have spent a little too much time putting in “junk miles”. The chart below shows a skew towards too much time spent in Zone 1/ Zone 2 and too little time putting that training time to use with more time in zones that will prep them for their goals.

PMC (Performance management chart)
So now you know how much time you put into training, but what did that get you? Turn to the PMC chart to see gains.  The above PMC chart is a great example of an athlete that had a few extra challenges thrown at him throughout the year (as I think we all did this year). Through hard work, he still managed to make the most of it and come out at the end of the season hitting personal bests. How did he get there? And how can he improve for next year?
The PMC chart is powerful in tracking builds within fitness, fatigue, Form. In the case of post-season review, we are able to see what leads to good or bad fitness. In the case of the above athlete, their big challenges of the year were a knee injury and COVID lockdown. How we overcame these two challenges were, firstly, a very slow early season build to keep the injury from recurring. Then, while they did lose a decent amount of fitness during the COVID lockdown, we recognized this and planned out two really stellar builds in early summer to get them back on track. After this point we used a six day bikepacking trip to really add in one final overload period and get the athlete to peak form. After some rest they were flying and hit three different PB's. Now looking back over the PMC we learn that this athlete responds well to large overload periods where he achieved 120+ATL, and then was able to rest and sharpen. The athlete hit peak peak fitness at 90+CTL, and performed very well at a very slight positive TSB. So the key takeaway here is the athlete performs really well with a pretty large foundation, large overload periods followed by rest, and then a pretty sharp form going into efforts. This is a huge bit of knowledge when planning for next year as we know what will be worth replicating and will lead to good form.
So this was a success story? Well ya...but always look for more. We know by looking at the PMC what this athlete performs well at, but if they want to be peaking earlier in the year then that changes everything. In this case, the focus early season should be to stay injury free and then start earlier so that we have the appropriate amount of time to get that athlete to that 90CTL sweet spot.
With the use of Fitness summary and PMC we are able to see what training you were able to do, if you need to do more, and maybe even if you need to do less.
PB’s! Tracking personal best’s using the Power Profile chart 
For the majority of athletes, grabbing five metrics will be plenty to help you track improvements as well as see what you should spend more time working on in order to achieve your goals. In this case we will use the five peak metrics that TrainingPeaks provides in the power profile chart (5second, 1minute, 5minute, 20minute, 90minute). By changing the settings of the chart you are able to set the time frame to whatever you would like. I like to leave it at 730 days so I am easily able to scroll through the last two years and see the different bests.
Using the above athlete as an example I put together his peaks from 2019 and 2020 to then have a side by side comparison. I also include watts/kilo so we have the opportunity to look at optimal weight as well as diet.
2019:
- 1116 watts 5 second (18.36w/kg)
- 662 watts 1 min (10.89w/kg)
- 424 watts 5 min (6.97w/kg)
- 353 watts 20 min (5.80w/kg)
- 301 watts 60 min (4.95w/kg)
2020:
- 1065 watts 5 second (17.52w/kg)
- 550 watts 1 min (9.04w/kg)
- 414 watts 5min (6.81w/kg)
- 380 watts 20min (6.25w/kg)
- 293watts 60min (4.82w/kg)
For this athlete our goal for the year was to push out his long-range climbing and repeatability so that he could be competitive in the American pro stage races. With no racing, we spent time focused on the 10-30minute range, which is reflected in his 20min and FTP change. This told us what was accomplished, although not where we needed to focus.
Through the power profile chart we are also able to see that the biggest metric that took a hit from 2019 to 2020 was his one minute. With the potential of races coming back in 2021, the one minute effort will be an important effort for this athlete to have in his quiver and will want to spend some focus time on moving ahead.
Regardless of what you’re training for, reflecting on past training successes and challenges is an important part of setting goals and building training plans for the year ahead. At the end of your season it's critical to take a look back at what you have achieved by doing a post season review. Using one's data archive is a great place to start - look at the 10,000 foot aerial view to put some numbers behind what you already know: what worked, what did not and therefore what can be improved upon for the following year in training. Using these three charts you’ll be able to put together that 10k foot view and then from there be confident in what you accomplished and then even better be ready to push your potential moving forward.
With the right approach, data can be a tool that can aid both athletes and coaches, alike. These are just a few of the charts that I find useful on a daily basis and I encourage you to give them a try. Let us know if you have any questions or what your favorite charts are on our forum : https://forum.fascatcoaching.com/
Copyright © 2022 FasCat Coaching - all rights reserved.
Join our *FREE* Athlete Forum to nerd out with FasCat coaches and athletes about your FTP, race data, power based training, or anything related to going fast on the bike! Isaiah is Coach with FasCat Coaching in Boulder, CO.
Isaiah has been talking the talk and walking the walk [FasCat Core Value #7] for over 15 years. To talk about your zones and training fill out a New Athlete Questionnaire to schedule a Coaching Consultation with Isaiah.